Engagement checking - ECT Align 2024-26
Section outline
-
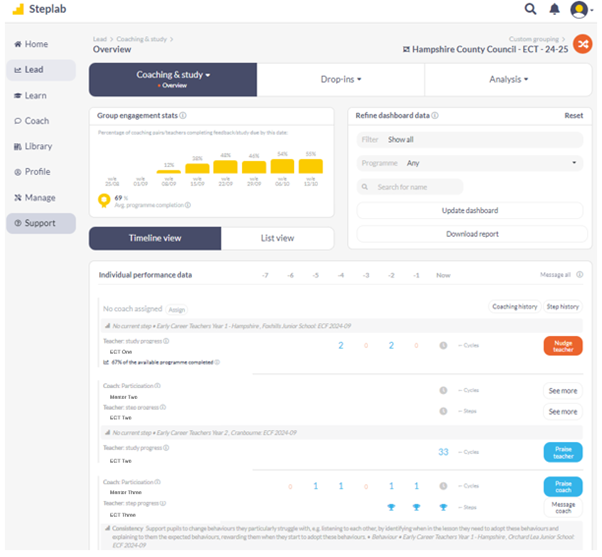
- Log in to Steplab
- Click ‘Lead’
- Select one of your cohorts using the orange switch button
.
From here you can see a range of indicators that show engagement for different parts of the programme.
.
.
Group engagement stats
This shows you the overall engagement of the cohort. Hovering over the yellow bars will tell you how much activity has taken place that week.
Refine dashboard data
You can use filter to select which data you wish to view – ECTs who have recently completed study or mentors who have recently completed coaching etc.
Individual performance data
The number next to the participants name shows the number or feedbacks completed/steps achieved.
The timeline takes into account that year 1 participants have a weekly cycle and a fortnightly cycle in year 2, and shows a quick overview of engagement over a time period. Hovering over any statistic shows the dates covered.